Matplotlib Challenge
The purpose of this project was to analyze how the weather changes as you get closer to the equator. To accomplish this analysis data was pulled from the OpenWeatherMap API to assemble a dataset on over 500 cities.
After assembling the dataset, we used Matplotlib to plot various aspects of weather vs. latitude. Factors we looked at included: temperatue, cloudiness, wind speed and humidity. This site provides the source data and visualizations created as part of the analysis as well as explanations and descriptions of any trends and correlations witnessed.
- python
- html
- css
- Javascript
- Matplotlib
- Bootstrap


Mars Webscraping
The purpose of this project was to analyze how the weather changes as you get closer to the equator. To accomplish this analysis data was pulled from the OpenWeatherMap API to assemble a dataset on over 500 cities.
After assembling the dataset, we used Matplotlib to plot various aspects of weather vs. latitude. Factors we looked at included: temperatue, cloudiness, wind speed and humidity. This site provides the source data and visualizations created as part of the analysis as well as explanations and descriptions of any trends and correlations witnessed.
- python
- html
- css
- Javascript
- Matplotlib
- Bootstrap


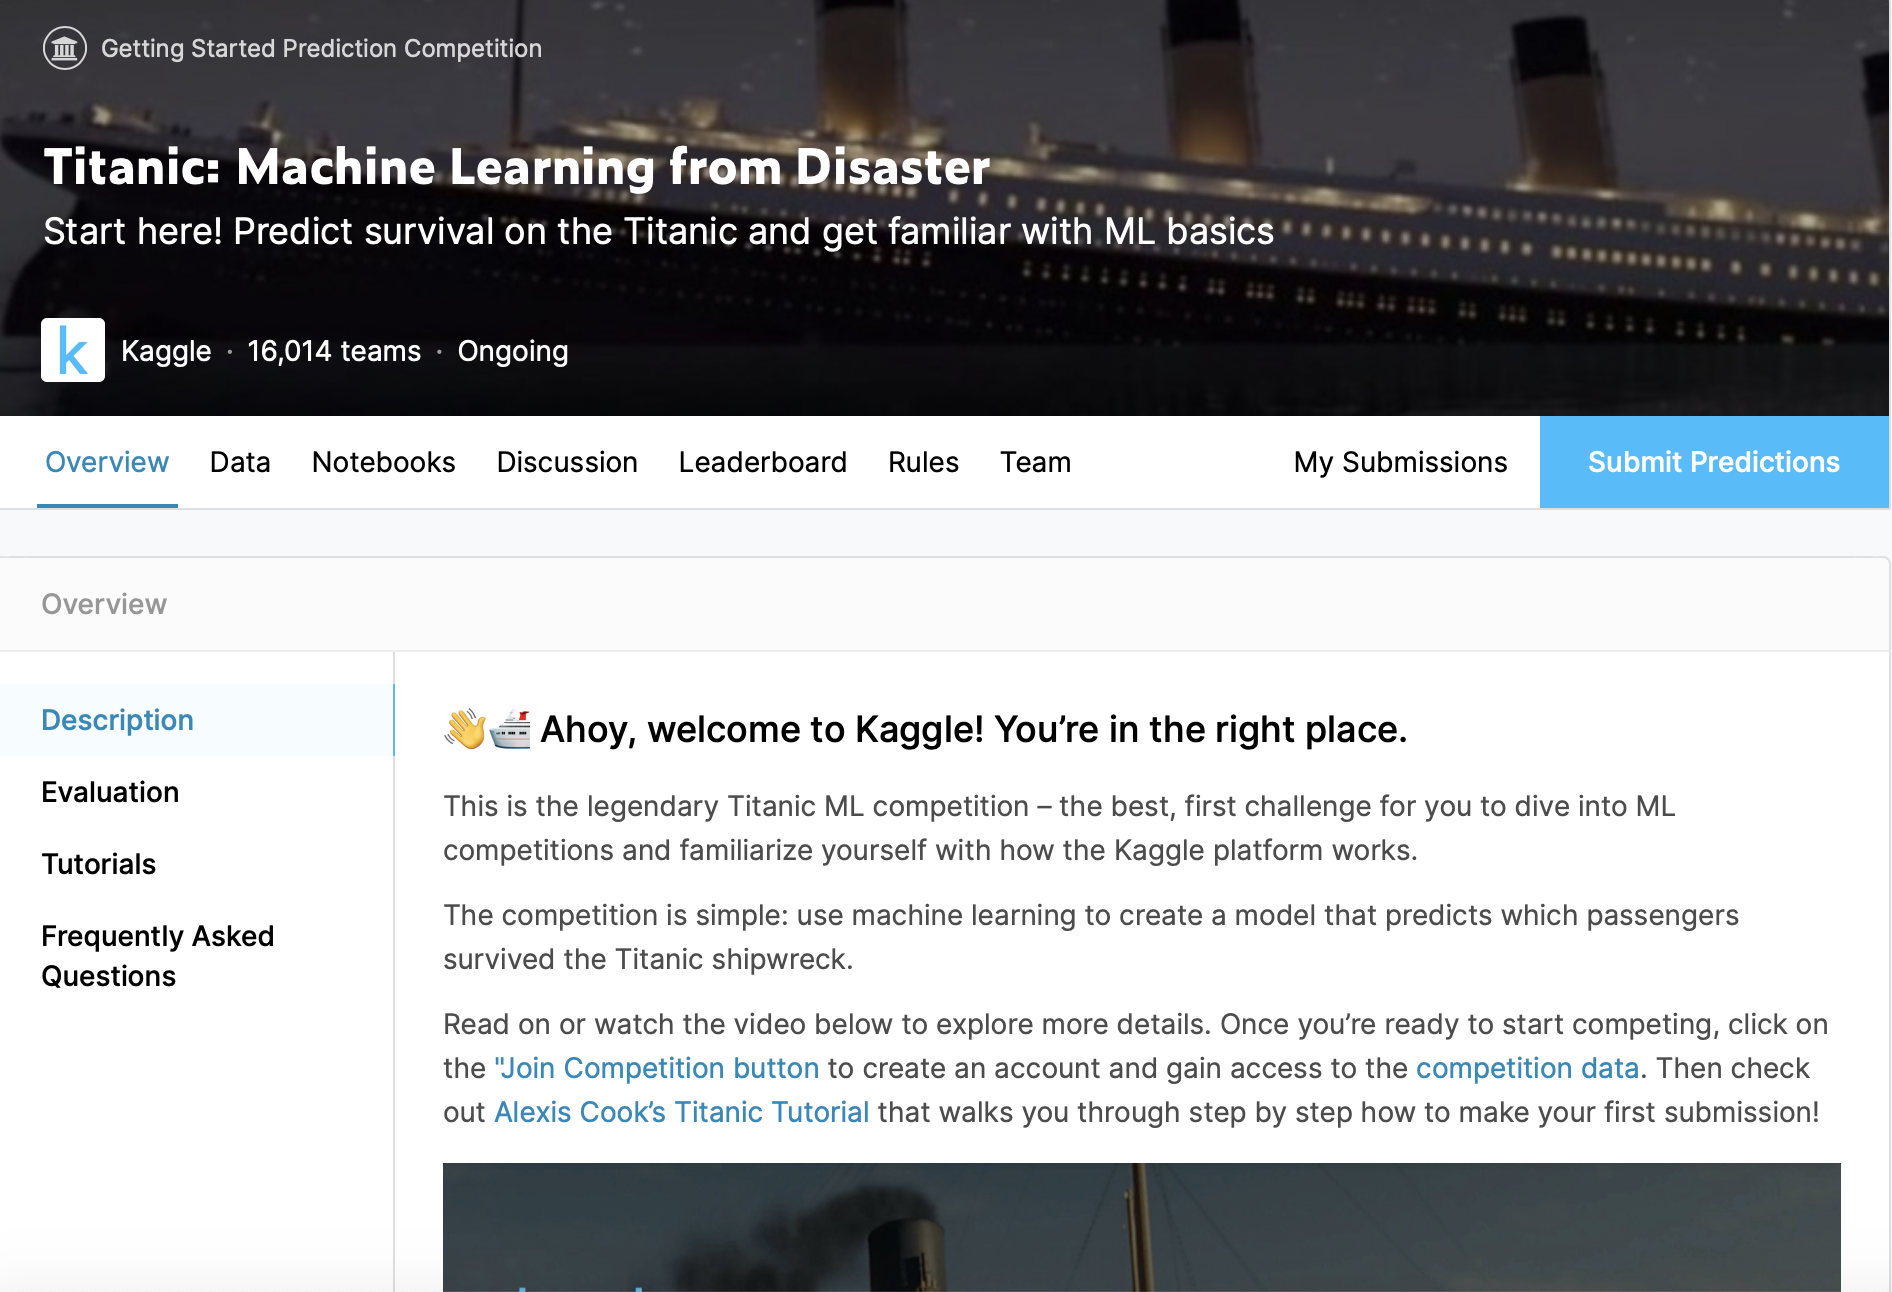
Titanic: Machine Learning from Disaster
The purpose of this project was to create a predictive model by using machine learning that answers the question of what sorts of people were more likely to survive. This was done by using the passanger data that was given in the competition such as age, gender,socio-economic class, and number of family members on board. The data to train the model and to test the model was given in a csv folder. By using data cleaning all of the nan values were replaced and all of the columns could be used to imrpove the model.
A random forest regressor model was chosen and then was tested using the Test data and was given %78 accuaracy. Below the link to the github repository will be posted
- Python
- Sklearn
- Pandas
- Data Cleaning


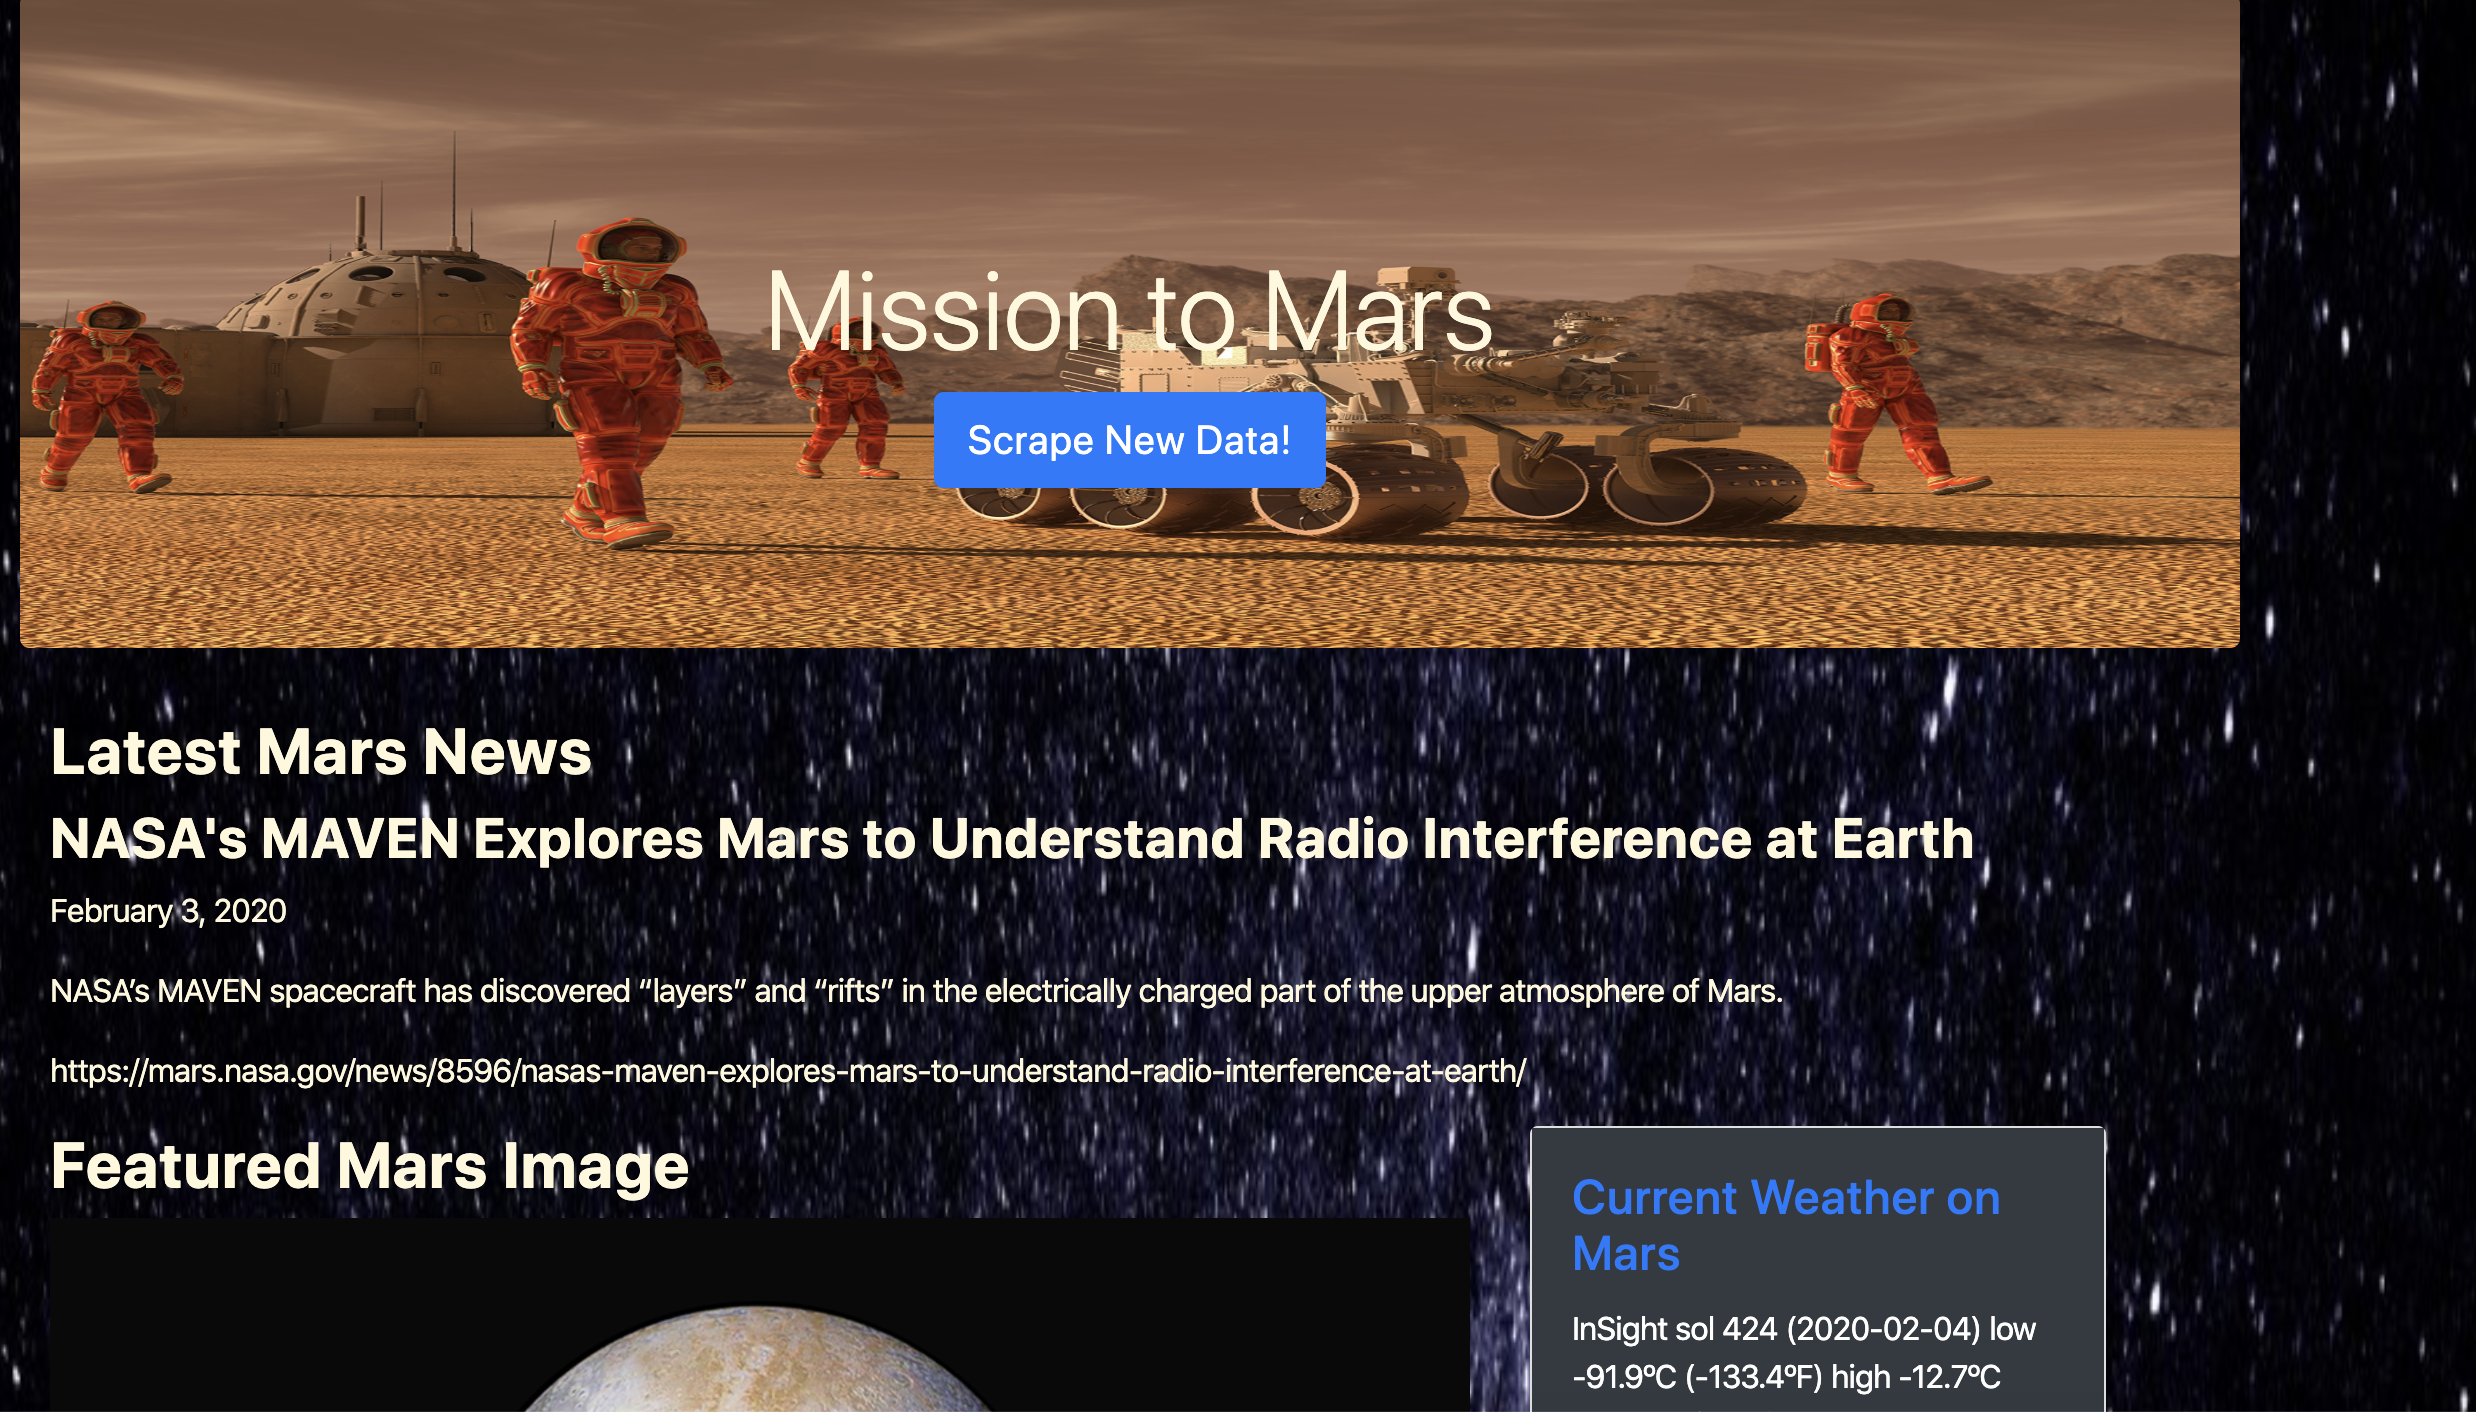
Mars Webscraping
The purpose fo this project was to build a web appliation which scrapes multiple websites for data related to Mars. Some examples of the data are the current weather one mars, mars weather twitter acount's last tweet, and pictures of the four hemispheres of Mars
The web application runs using html, javascript, css, and python. Therefore the website which I deployed on Github's services cannot run but below I will attach a link to my source code.
- python
- html
- css
- Javascript
- splinter
- Twitter API
- Bootstrap


Belly Button Biodiversity Project
The purpose of this project was to build an interactive dashboarrd board to explore the belly button Biodiversity dataset. This dataset catalogs the microbes that colonize human belly buttons.
The datset reveals that small handful of microbial specias(called taxonomic units,OTUs in the study) were present in more than 70% of people in the study while the rest were relatively rare.
- python
- D3
- json
- Plotly
- html
- css
- Javascript
- Bootstrap


Weather Data Visualization
The purpose of this project was to analyze how the weather changes as you get closer to the equator. To accomplish this analysis data was pulled from the OpenWeatherMap API to assemble a dataset on over 500 cities.
After assembling the dataset, we used Matplotlib to plot various aspects of weather vs. latitude. Factors we looked at included: temperatue, cloudiness, wind speed and humidity. This site provides the source data and visualizations created as part of the analysis as well as explanations and descriptions of any trends and correlations witnessed.
- python
- html
- css
- Javascript
- Matplotlib
- Bootstrap


